Based on the two lists just presented, what we are seeing in telecommunications, therefore, are trip substitution opportunities arising simultaneously with travel demand growth.
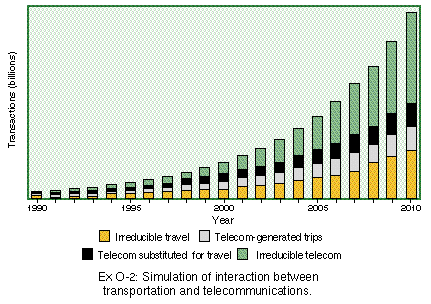
The figure below is a graphic that illustrates our model of the interaction effects between transportation and telecommunications in any country. The graphic is a mathematical construction of plausible economic effects unrelated to any specific empirical data. It is intended to illustrate generic structural relationships. This graphic is derived from a similar one shown by researcher Ilan Salomon.
The assumption made here is that transactions are a common metric for measuring both telecommunications and transportation. Exhibit O-2 shows overall transaction volumes mapped as annual quantities in the vertical bars. The bars are divided into four sections, the lower two of which are travel transactions. The upper two sections in each bar are telecommunications transactions.

The telecommunications transactions are made up of some that are a substitution for travel and other telecommunications transactions that bear no relationship to travel. Similarly, the transportation transactions are made up of those that are stimulated by telecommunications, for one of the reasons on the list previously presented, and those that are not.
This model highlights two key points about transportation-telecommunications interactions: first, that telecommunications is both a substitute for travel and a stimulant and, second, that the net overall effect of telecommunications on transport, whether a net substitute or net stimulant, depends on whether list one or list two given above is dominant. If telecommunications substitution events add up to more travel miles saved than miles generated by telecommunications-induced stimulation, then there is net substitution. If the reverse is true, then there is net stimulation of travel by telecommunications.
In the figure, trip-replacing telecommunications transactions are set equal to trip transactions that are stimulated by telecommunications. Thus, the effect of telecommunications on transportation volumes is shown as neutral. This neutrality is an arbitrary assumption, however, made in the absence of data that measure both kinds of transactions in an entire economic region.
Whether the effects in the earlier list of travel substitutions outweigh the effects in this last list of travel stimulants is still an open question. Certainly, per-capita travel demand is showing very strong growth in advanced and developing economies. Travel growth occurs even as telecommunications volumes grow. Growth in travel is of course influenced by current policies and prices affecting transportation. When travel on the usual routes becomes impossible, such as when bridges and roads were made impassable in the October 1989 and January 1994 California earthquakes, telecommunications usage and telecommuting soar until the roads are restored; but, in the case of San Francisco at least, some new telecommuters continued the practice part time even after conditions returned to normal.
An analytical econometric determination of how telecommunications and transportation have been balancing out as economic inputs in normal (nonearthquake) economic circumstances to date is an important research need. The scale of analysis could range from that of a metropolitan region to a nationwide scale to cross-national comparisons. The functionality of the NII has been improving and traffic congestion has been worsening for a quarter century now. We should therefore expect to see by now a trend toward travel substitution emerging in economic input-output tables, if the conventional wisdom on telecommunications holds true as commercial and social interactions evolve. Careful measurement is needed.
![]()
Go to:
![]()